Istio Prometheus Demo
What will I cover in the post?
You will see how to query Istio metrics using the Prometheus add-on.
Istio add-ons
Istio add-ons allow to use advanced Istio features.
Istio Prometheus add-on
We will start from the Prometheus add-on. Prometheus is an open-source systems monitoring and alerting toolkit.
Prometheus add-on allows to you to query Istio metrics.
Istio Metrics
Istio generates metrics for all service traffic. The partial metrics list is below:
- the overall volume of traffic
- the error rates within the traffic
- the response times for requests
Istio Bookinfo Demo application
In my previous post I have described how to install the Istio Bookinfo Demo application.
To continue to work with the Prometheus demo you should first install the Bookinfo Demo application.
Prometheus add-on deployment
Let’s deploy the add-on using the following command:
kubectl apply -n istio-system -f https://storage.googleapis.com/gke-release/istio/release/1.0.3-gke.3/patches/install-prometheus.yaml
You will see the following output shows that the add-on is deployed successfully:
clusterrole.rbac.authorization.k8s.io/prometheus-istio-system created
serviceaccount/prometheus created
clusterrolebinding.rbac.authorization.k8s.io/prometheus-istio-system created
service/prometheus created
deployment.extensions/prometheus created
metric.config.istio.io/requestcount created
metric.config.istio.io/requestduration created
metric.config.istio.io/requestsize created
metric.config.istio.io/responsesize created
metric.config.istio.io/tcpbytesent created
metric.config.istio.io/tcpbytereceived created
prometheus.config.istio.io/handler created
rule.config.istio.io/promhttp created
rule.config.istio.io/promtcp created
Google Cloud SDK
In the next step You will need to forward a port from your local server to an application that deployed in GKE. The simplest way is to do it via Google Cloud SDK.
Please install the SDK using the link to quickstart of your OS.
Port forwarding
Now we need to configure port forwarding from your local server to the Prometheus UI.
If your local server runs the Linux OS execute the following command:
kubectl -n istio-system port-forward $(kubectl -n istio-system get pod -l app=prometheus -o jsonpath='{.items[0].metadata.name}') 9090:9090 &
If your local server runs the Win OS execute the following command:
kubectl -n istio-system get pod -l app=prometheus -o jsonpath={.items[0].metadata.name} > prometheus.txt
set /p  PROMETEUS=<prometheus.txt
kubectl -n istio-system port-forward %PROMETEUS% 9090:9090 &
In both cases we will see the following output shows the port forwarding works:
Forwarding from 127.0.0.1:9090 -> 9090
Forwarding from [::1]:9090 -> 9090
Access to Prometheus UI
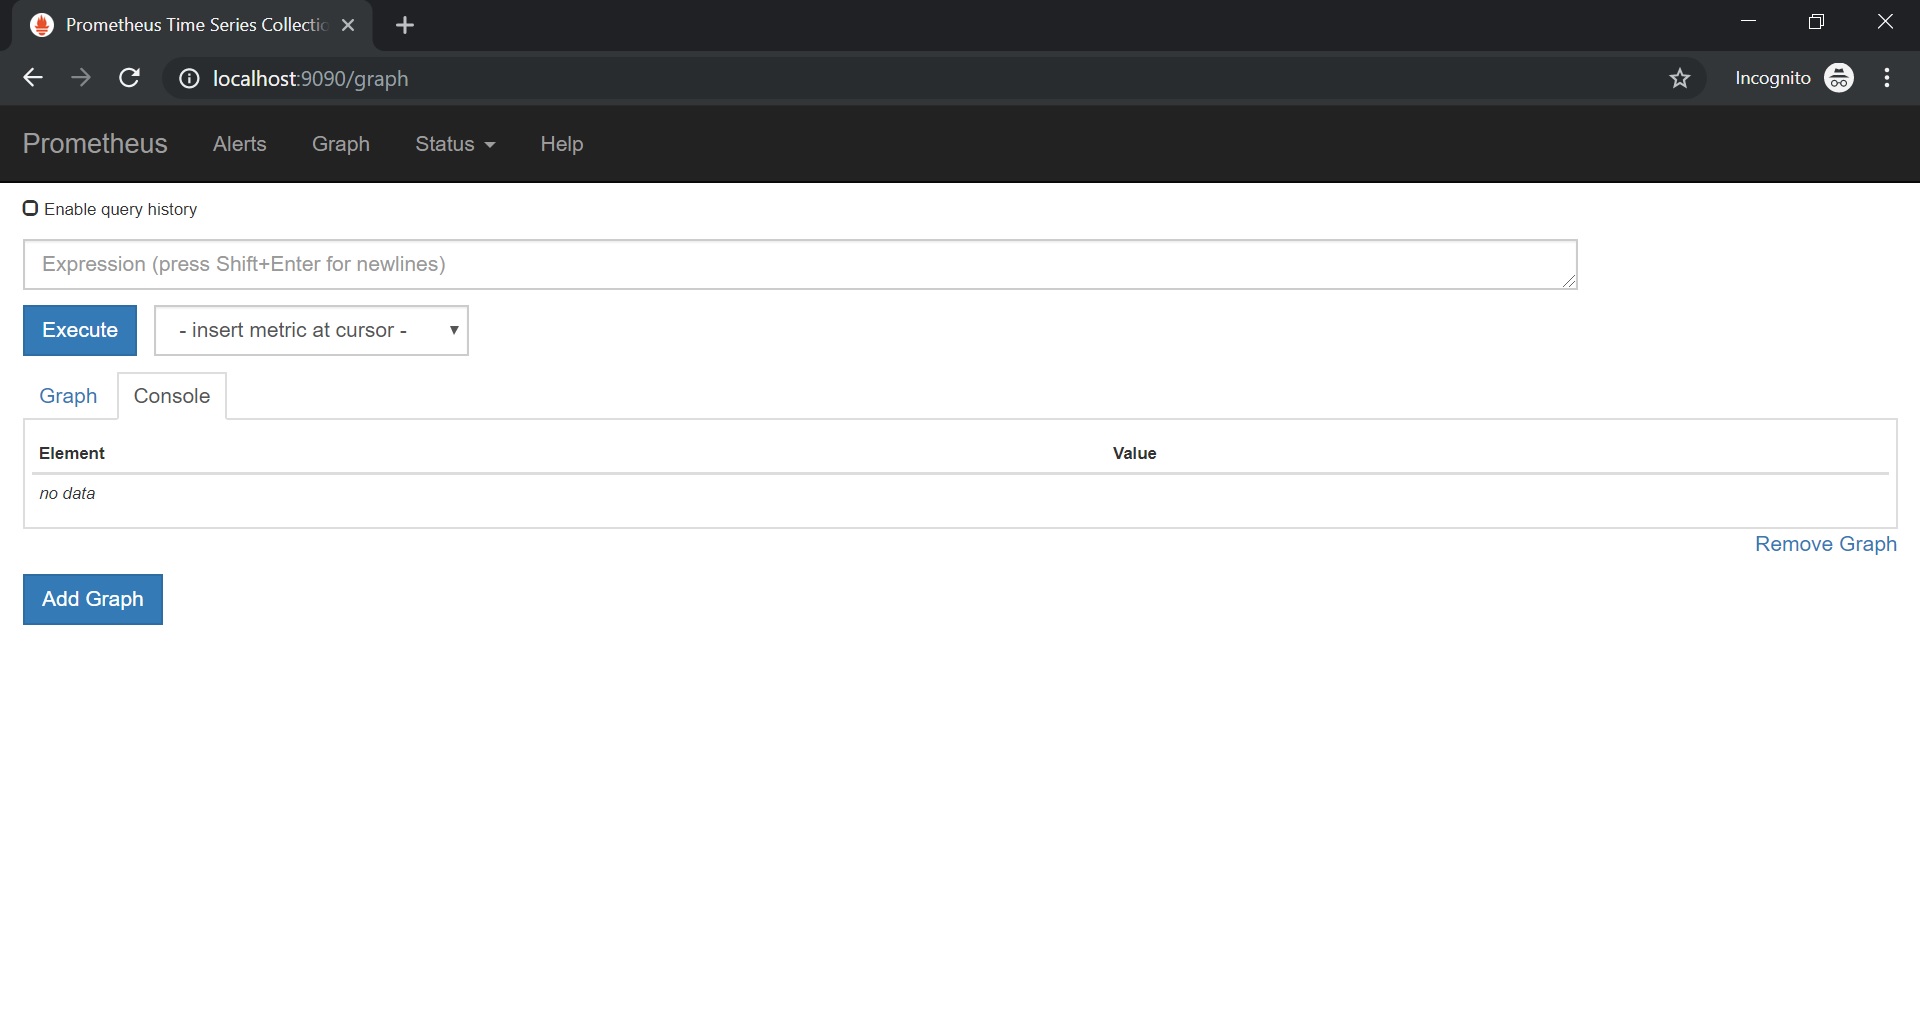
Lets open the Prometheus UI: http://localhost:9090

Prometheus metrics after the traffic load.
We will add some traffic load using the following command:
for i in {1..50}; do curl -s "\n" "http://${GATEWAY_URL}/productpage" | grep -o "<title>.*</title>"; sleep 1; done
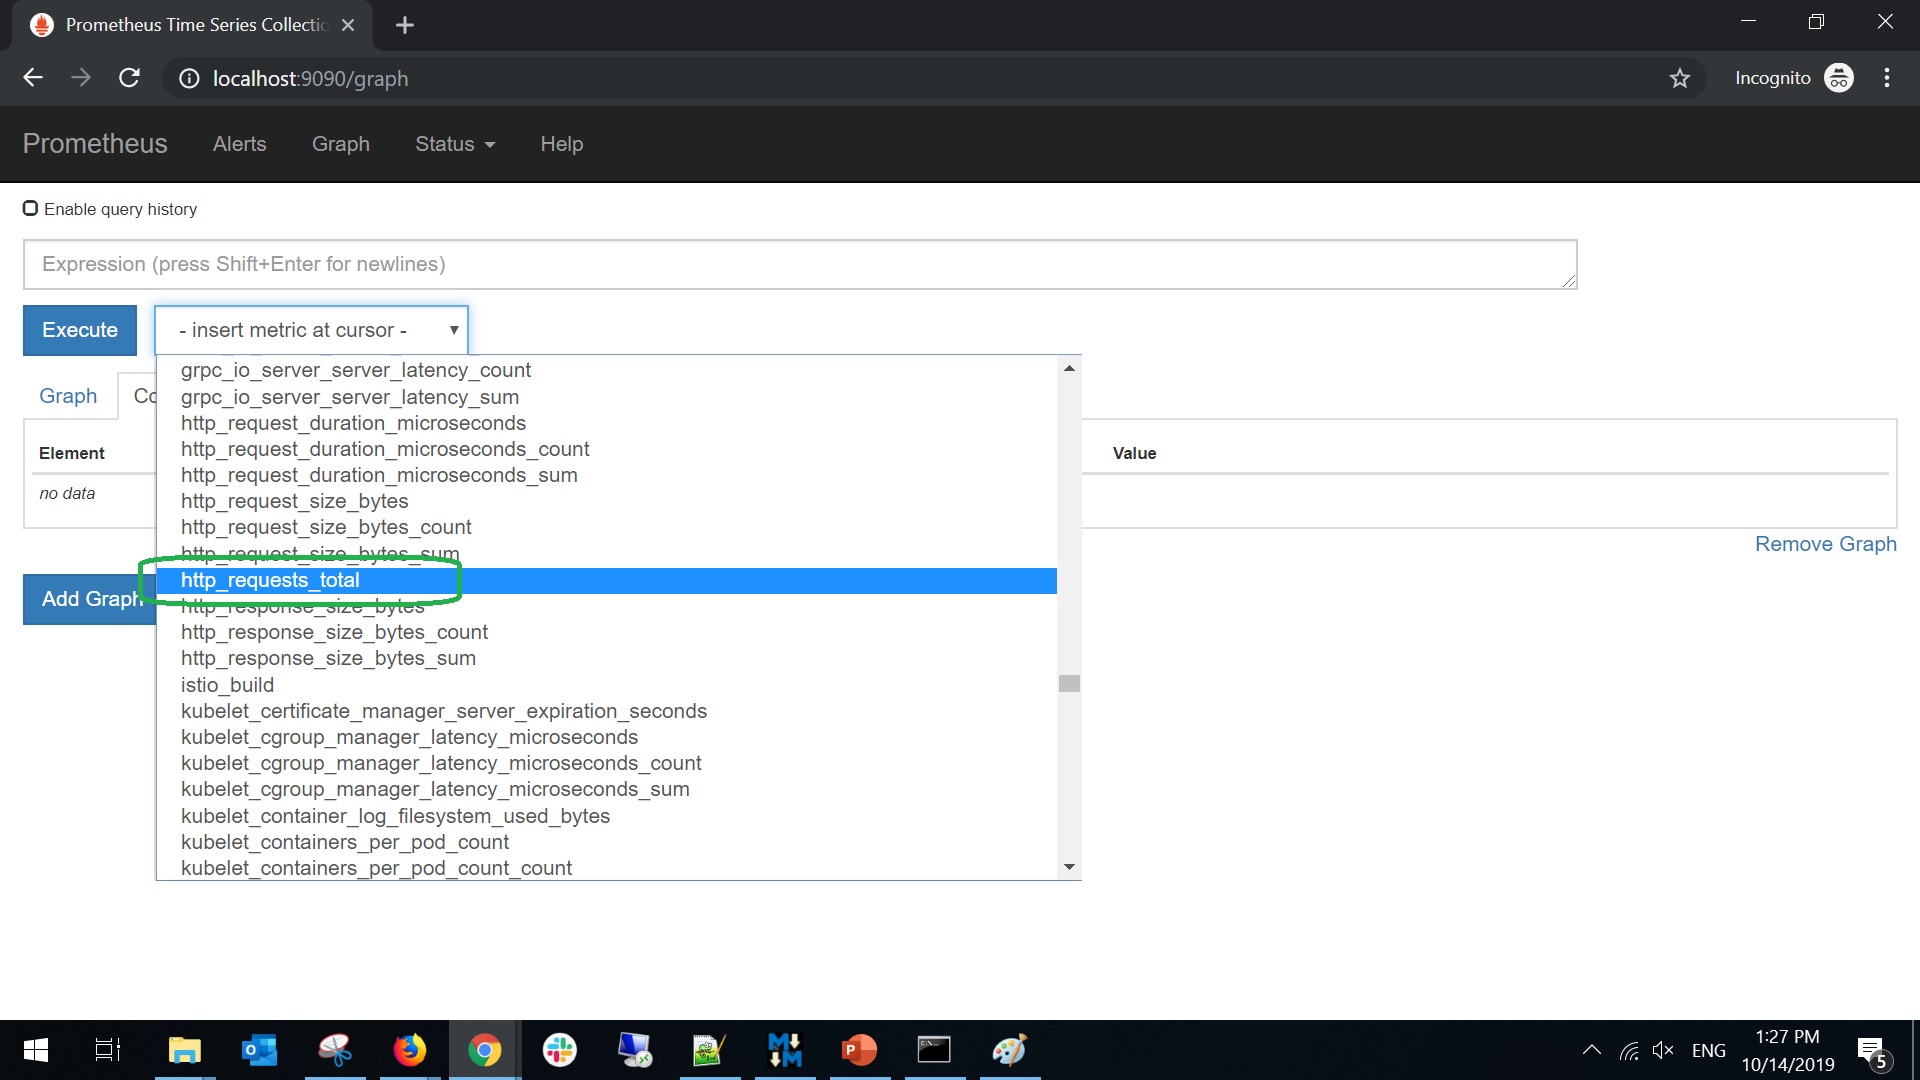
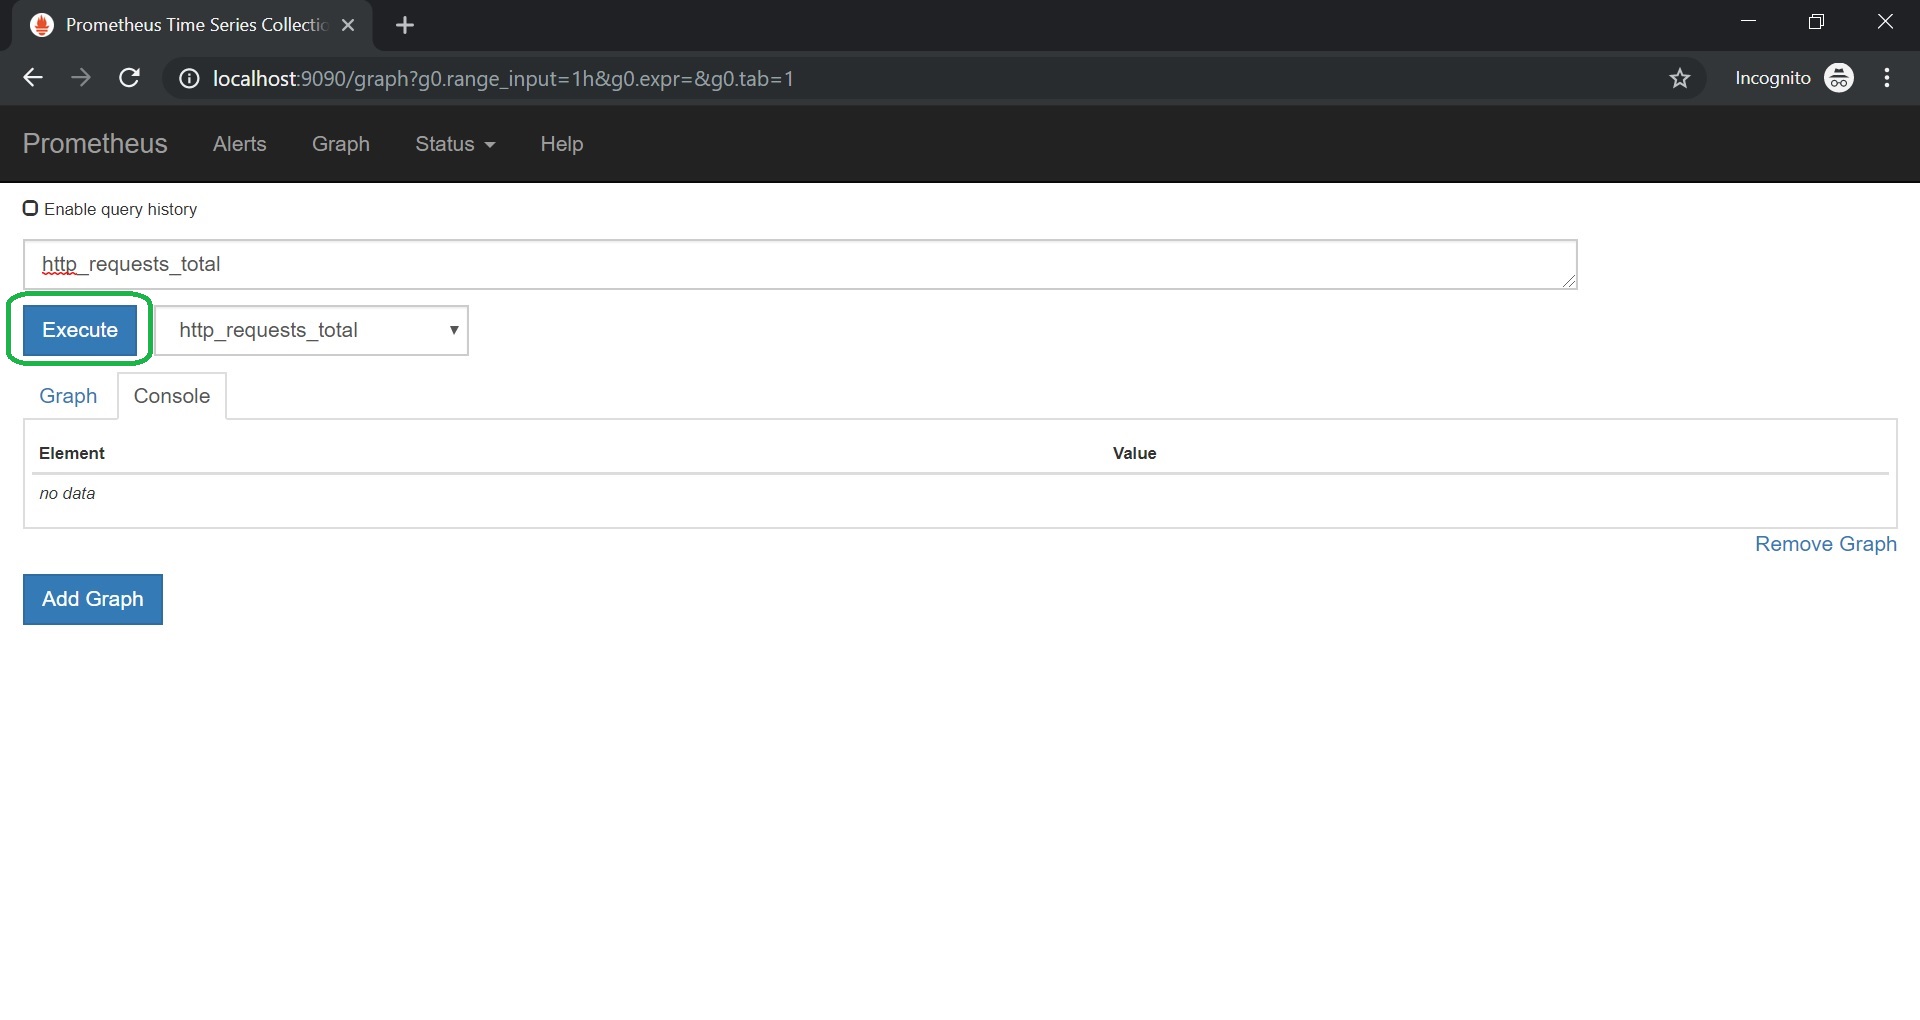
Now we will select the http_requests_total metric:


And yes, we have successfully completed our demo!
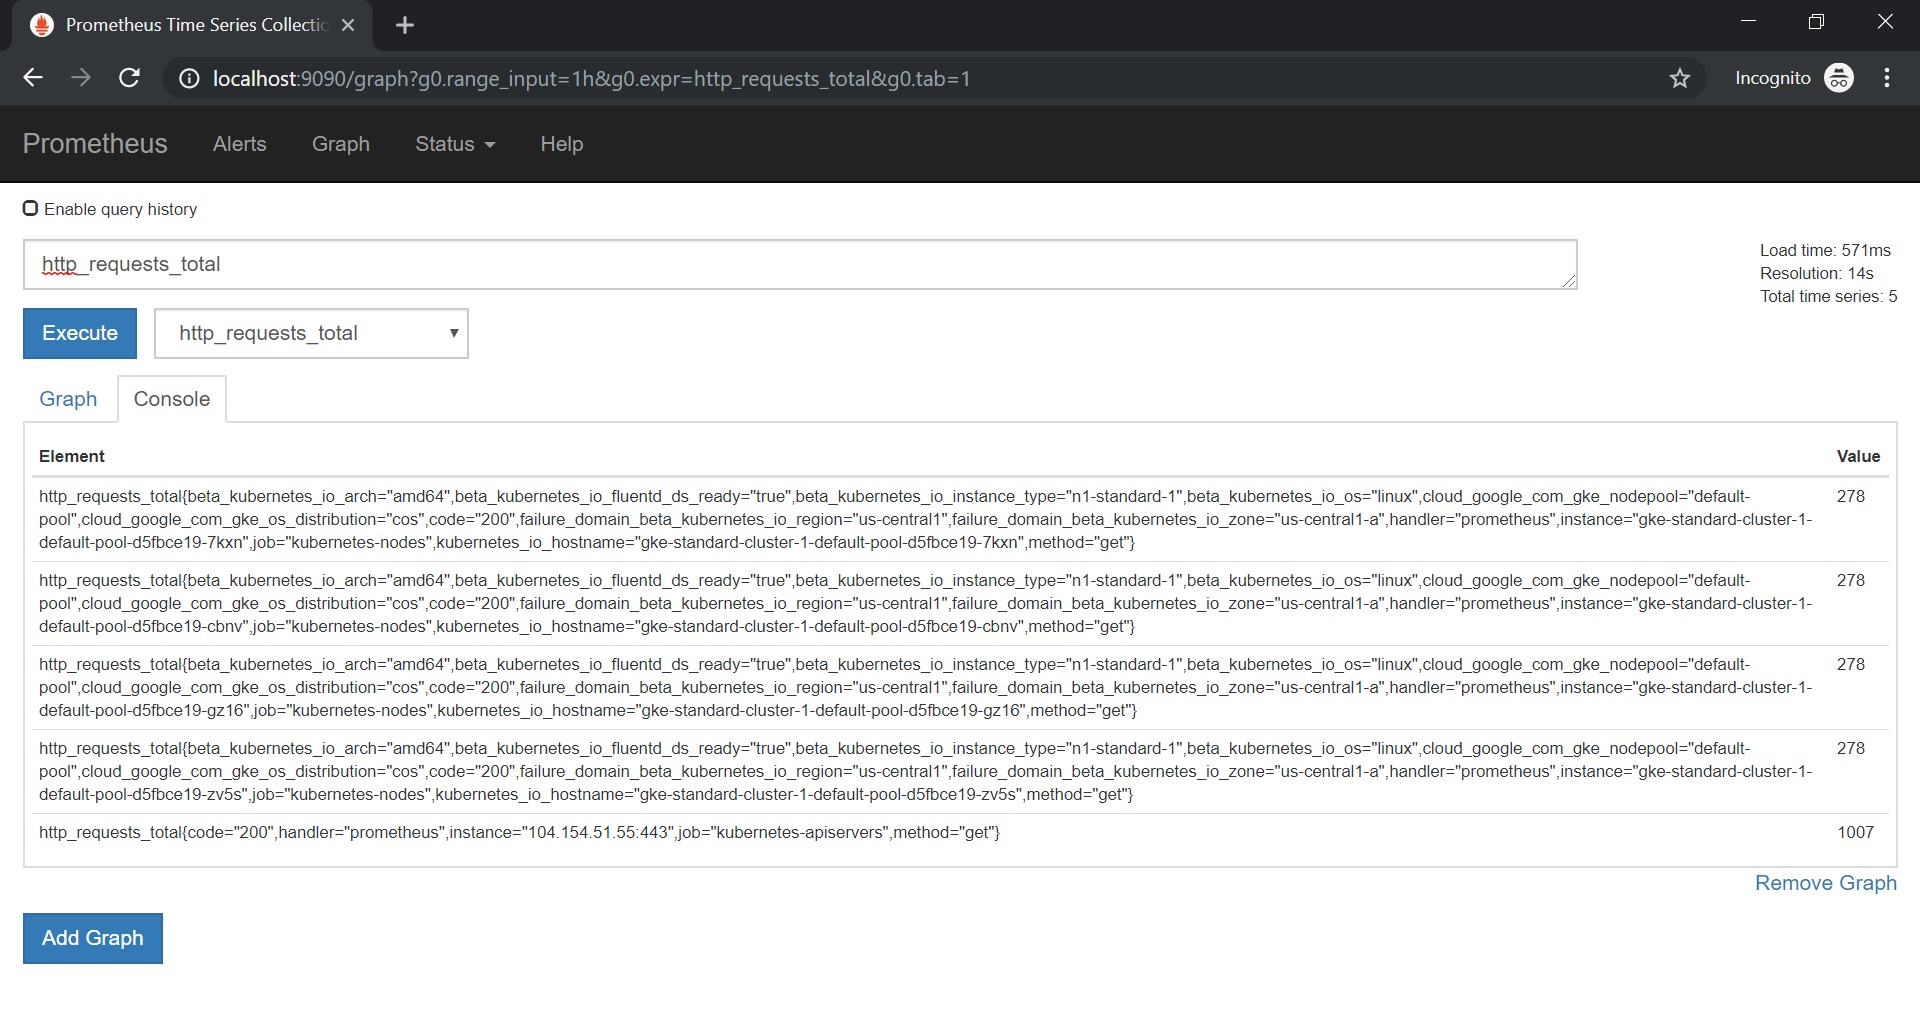
We can see the request data in the Prometheus UI:

Take Aways
You can take the following take aways from the post:
You see that Istio add-on allows to use Istio advanced features in the very easy way. You see how to use the Grafana add-on.